Difference between revisions of "Zynthian Webconf debug with Visual Studio Code (VSC)"
| Line 124: | Line 124: | ||
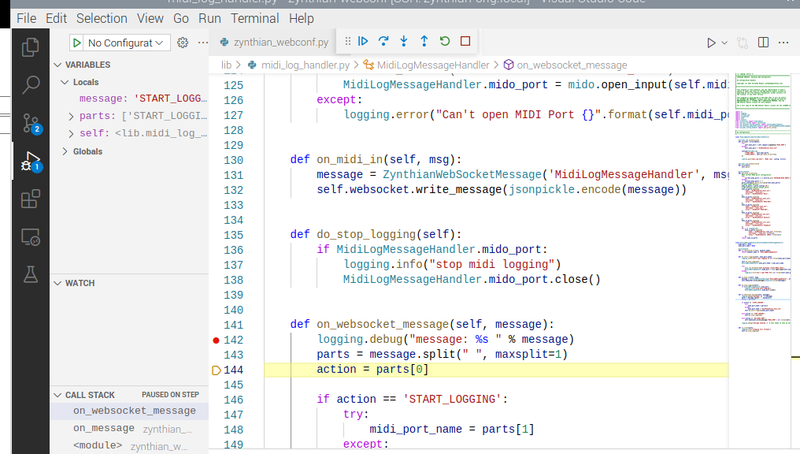
The program will halt on the debug line 132, and you should be able to operate the debugger transport controls and all the nice debug tools that will display and set values. | The program will halt on the debug line 132, and you should be able to operate the debugger transport controls and all the nice debug tools that will display and set values. | ||
| + | The following shows it after step over has been pressed twice. . . | ||
[[File:Vsc debug stepover.png|thumb|center|800px]] | [[File:Vsc debug stepover.png|thumb|center|800px]] | ||
Revision as of 18:16, 11 January 2022
Debugging Webconf with Visual Studio Code
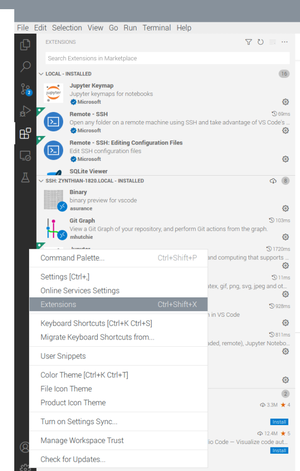
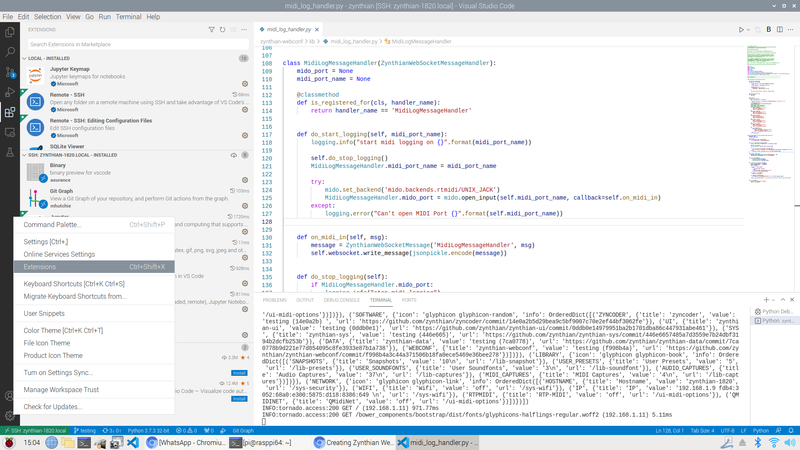
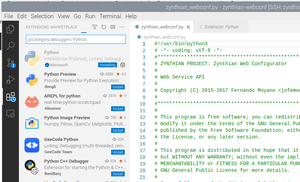
This is presented as an example of how a Visual Studio Code can be used to examine a component of the zynthian sub system as it runs using the Visual studio Code extensions, python & remote-ssh. These are loaded using the cog dialog at the bottom of the vsc code page.
Once you have these components added you can attempt to log onto an existing Zynthian from your PC, MAC, or linux machine, just so long as it's capable of running Visual Studio Code. In my own case I have it running on a 64 bit Raspbian instance, and I had to build it from source to get it running which is a degree of proof of the overall flexibility of what is after all a Microsoft product!
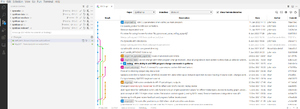
I also tend to add the git-graph extension.
The ssh connection
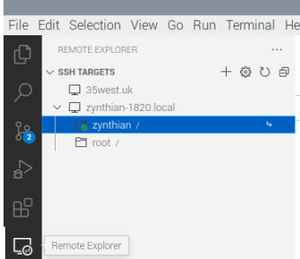
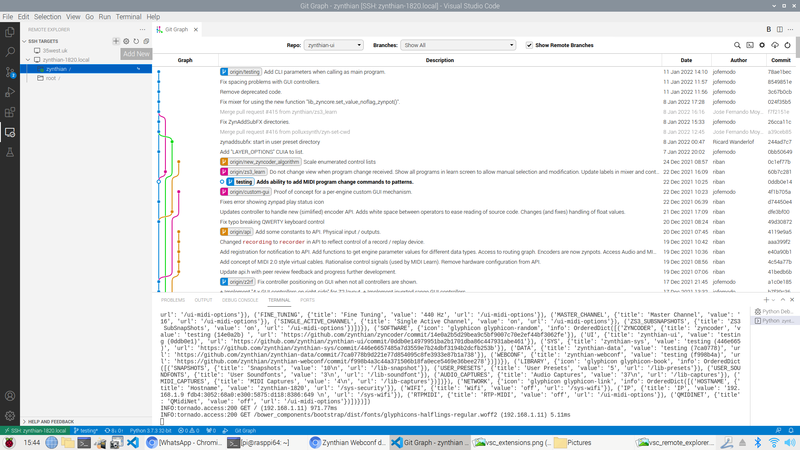
The addition of the remote component adds the Remote Explorer element
I already have a couple of remote zynthians in the machine and VSC is pretty tenacious at hanging onto remote instances it knows about. But we will try to add a new machine.
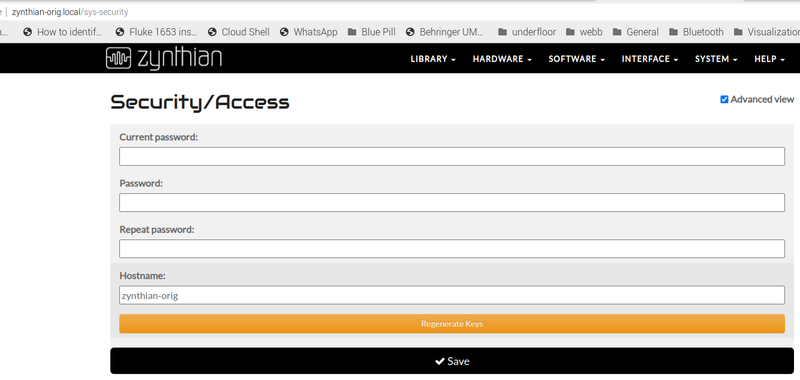
I have a zynthian called zynthian-orig.local. It's actually a genuine zynthian product running a Pi3 and no membrane switches and some fairly simplistic interface. Indeed it has to be disassembled to change the ssd. Such were the early days.!
1 Visual Studio Code Configure.
Firstly we need to add the extensions.
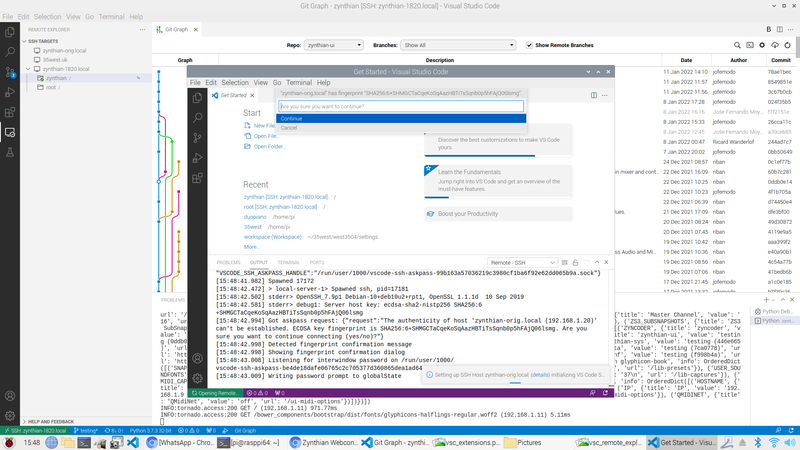
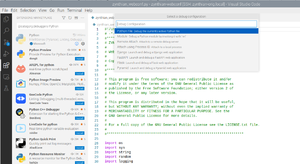
activated by the cog in the bottom left hand corner of the Visual Studio Code interface This will give us a command line that will attempt to log on to the server we are pursuing.. . .
So lets make sure that it is actually running.
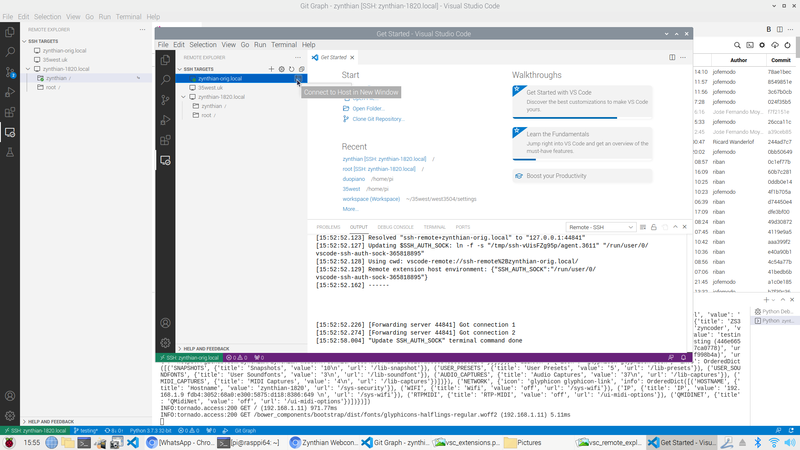
To access this we press on the + button against the appropriate machine. ( images a little awry here )
we enter the command we will use to access the remote zynthian which is ssh....
And login using the machines root password.
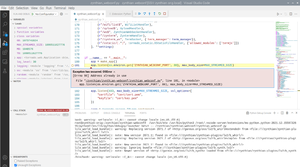
Once VSC has established a connection, it will download the appropriate python components to the zynthian to allow debugging to take place remotely. This make take some time and als o may complain about missing components, giv it some time it will get here if it possibly can....
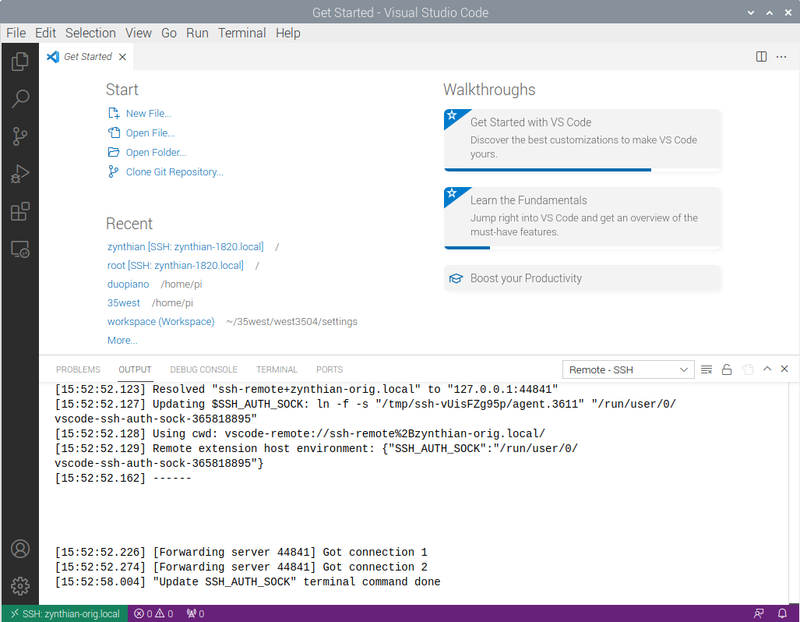
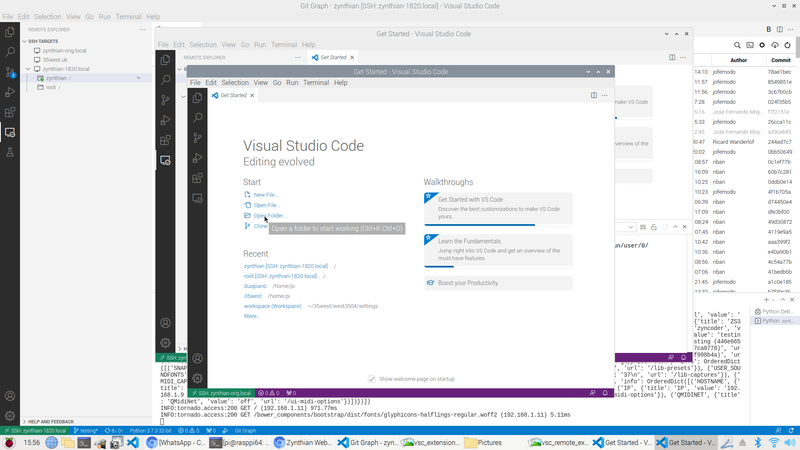
and as you can see the zynthian-orig.local machine is recognised by visual studio code.
2 Selecting the home directory on the Remote server
We have logged onto the home directory for the root user, but that isn't where zynthian-webconf runs from.... We should also turn off the running instance but I've left that as a gotcha for later in this walk throu'
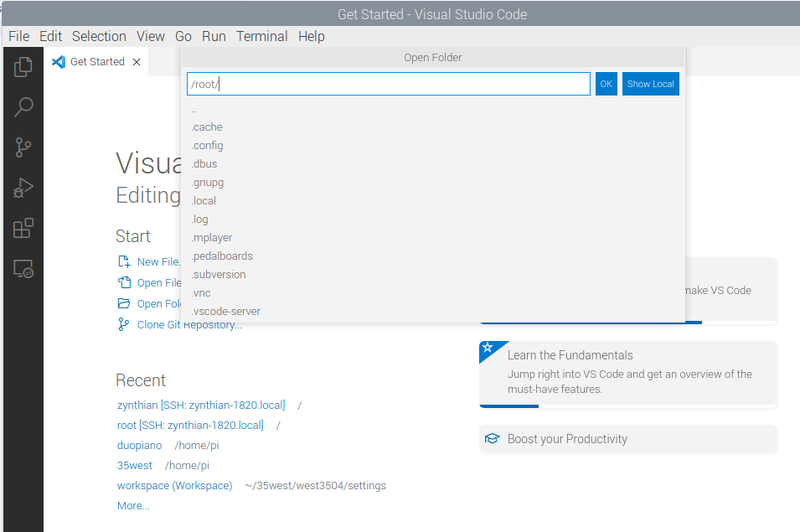
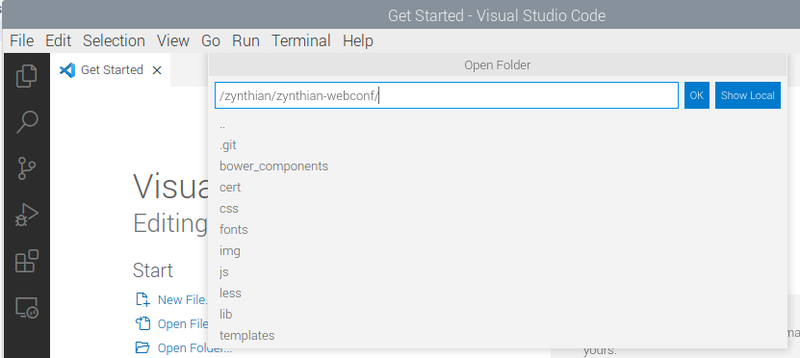
VSC will pop up a helpful file location prompt to help this populated with the defualt, we however, wnt to change this.
So we will be using zynthian-webconf so we need to select the appropriate folder location to run this from ... In our case /zynthian-zynthin-webconf/
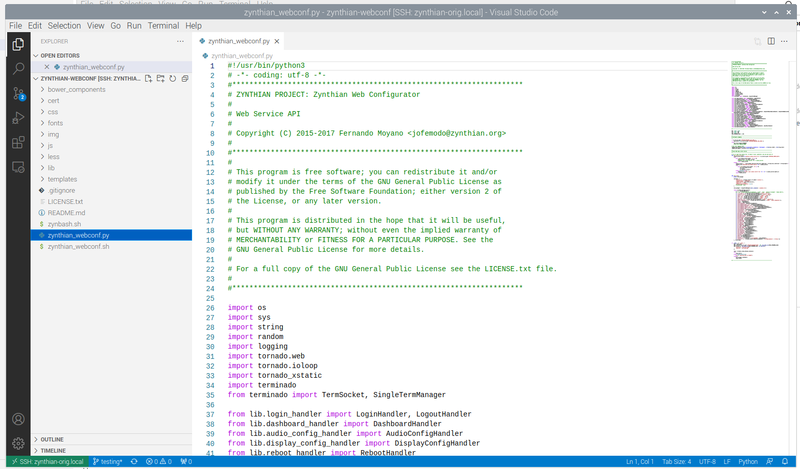
And when it's done it's stuff you can see and select the python file that runs webconf and examine it....
3 Running the Debugger
4 Turning off Running Webconf instance
We run the debugger,
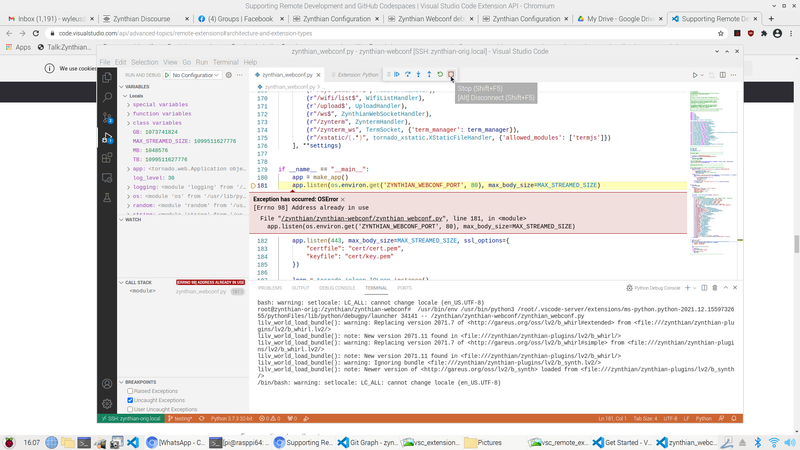
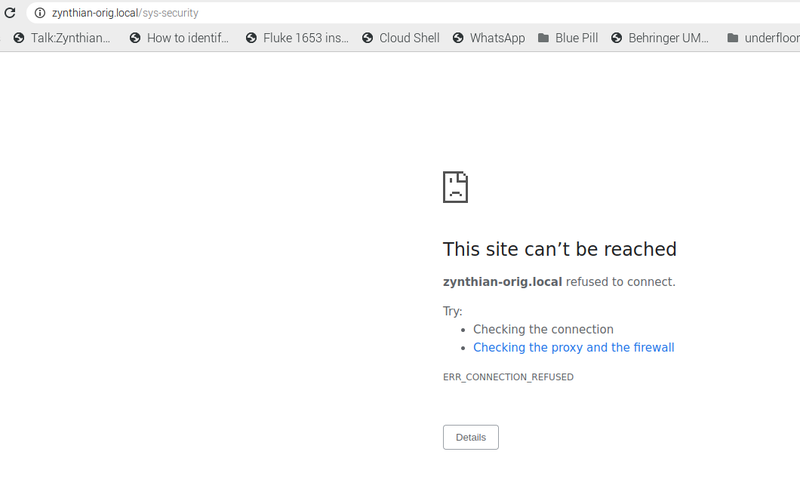
Error!!
but there is already a process running that has grabbed the port 80. It's the zynthian-webconf instance that is started by the raspberry pi when it starts up by systemd and this will need to be stopped to allow us to run our own instance....
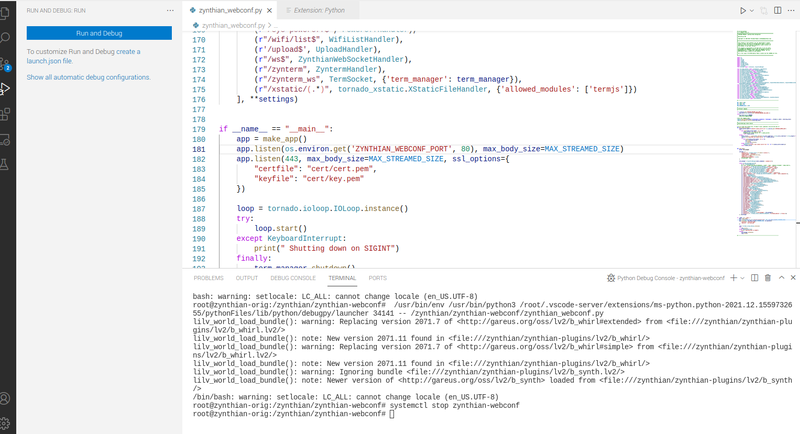
So we use the terminal to generate a command line prompt and shout at systemd to turn of the running instance
systemctl stop zynthian-webconf
And look it's no longer running!!!
5 Running the debugger in anger ...
So leaving with the zynthian-webconf.py module highlighted start the debugger as before.
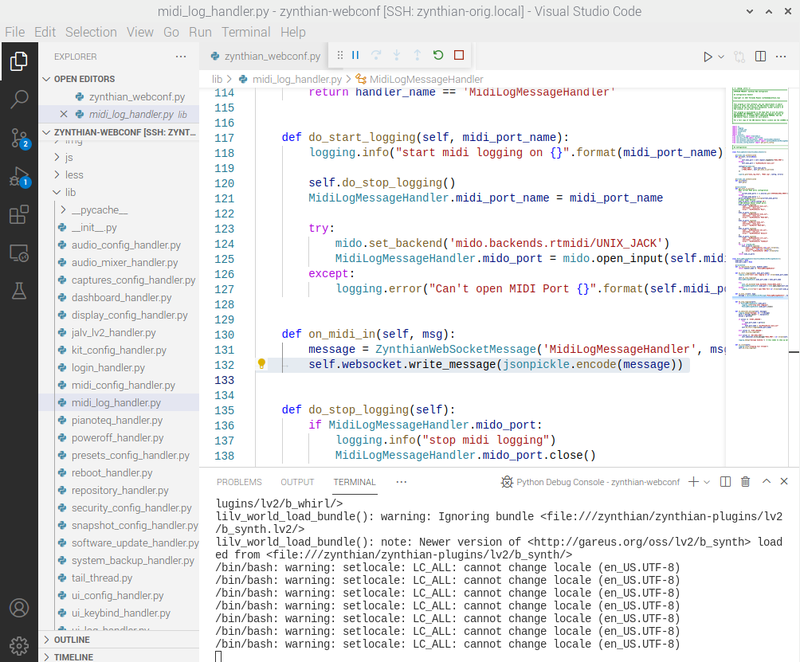
And then go and open the lib/midi_log_handler.py page once the web server is running and highlight the line 132 by pressing to the left of the line number a red circle should appear. . .
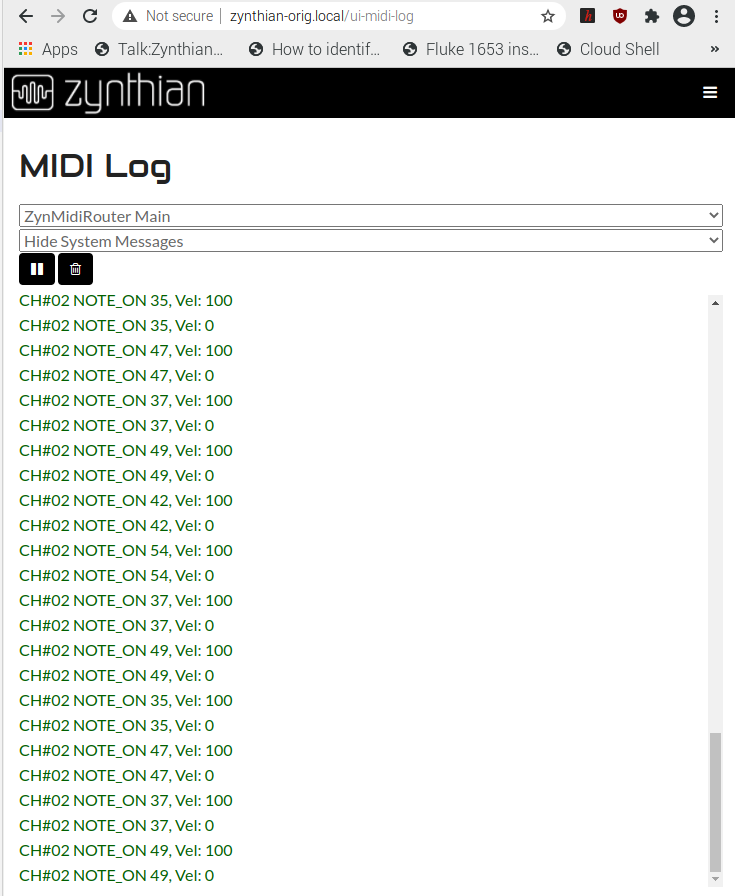
Then select the midi log page within webconf and play some midi . . . .
The program will halt on the debug line 132, and you should be able to operate the debugger transport controls and all the nice debug tools that will display and set values. The following shows it after step over has been pressed twice. . .
